There is a number everyone knows about the Muslim world: Muslims are having lots of babies. It powers op-eds about "Eurabia," shapes immigration politics on three continents, and gets quoted so often that challenging it feels contrarian. In the 1970s it was true — the median Muslim-majority country had a fertility rate of 6.8 children per woman, far above the world average of 4.9.
Here is the number almost nobody knows: today that median is 2.75. In sixty years, the Muslim world has run through a demographic transition that took Europe a century and a half. The story of Muslim demography in the 21st century is not a baby boom. It is a baby bust.
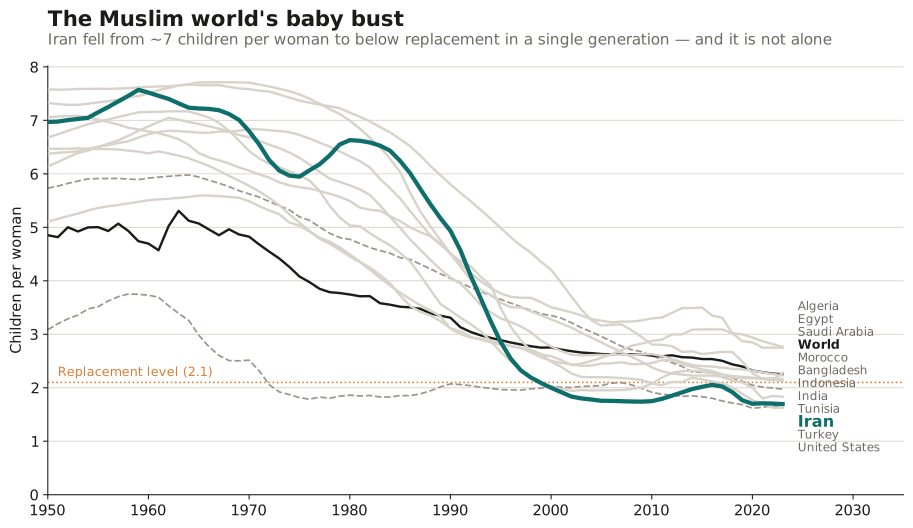
Look at Iran — the teal line. In 1980, the year after the Islamic Revolution, Iranian women had 6.6 children on average. Twenty years later: 2.0. A fall of four and a half children per woman in two decades. No war, no famine, no one-child policy. Just one of the fastest voluntary fertility declines ever recorded, in a country run by clerics.
And Iran is not an outlier. It is the pattern.
01 — The number everyone quotes is wrongThe fastest transition in history
Demographers measure transition speed by counting the years a country takes to fall from 6 children per woman to 3 — the classic descent from "traditional" to "modern" fertility. When you rank every major country on that measure, something startling appears: the top of the table is a wall of Muslim-majority countries.
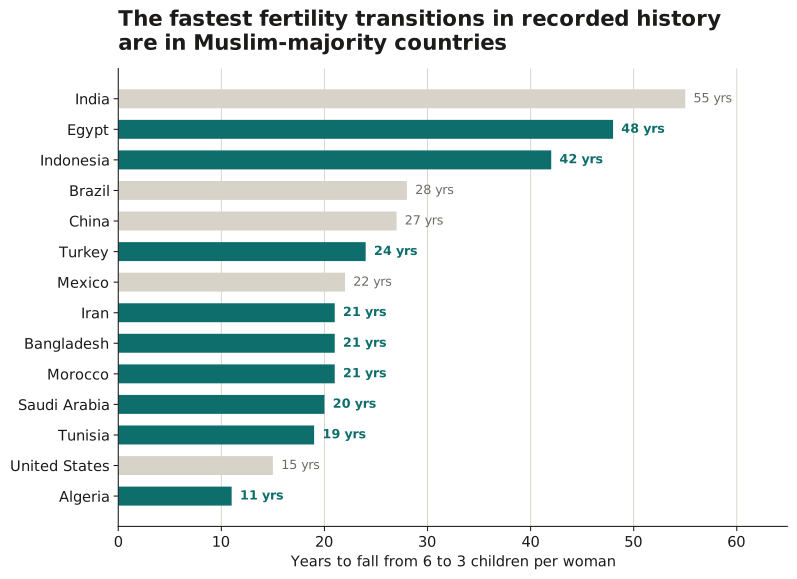
Algeria did it in eleven years. For comparison, the historical record books say France and England needed 70 to 100 years for the same journey in the 18th and 19th centuries. China — with the coercive apparatus of the one-child policy — took 27. Bangladesh matched Iran at 21 years while remaining one of the poorest countries in Asia, which quietly demolishes the idea that fertility only falls once countries get rich first.
02 — The silent crossoverA quarter of the Muslim world is now below replacement
The replacement rate — roughly 2.1 children per woman — is the level at which a population eventually stops growing. Cross below it and, give or take a few decades of momentum, decline becomes arithmetic destiny. In 1980, exactly one of the 53 Muslim-majority countries in the UN data was below that line. In 1990, still one.
Then the dam broke: five by 2000, ten by 2010, and fourteen by 2023 — more than a quarter of the Muslim world, home to hundreds of millions of people.
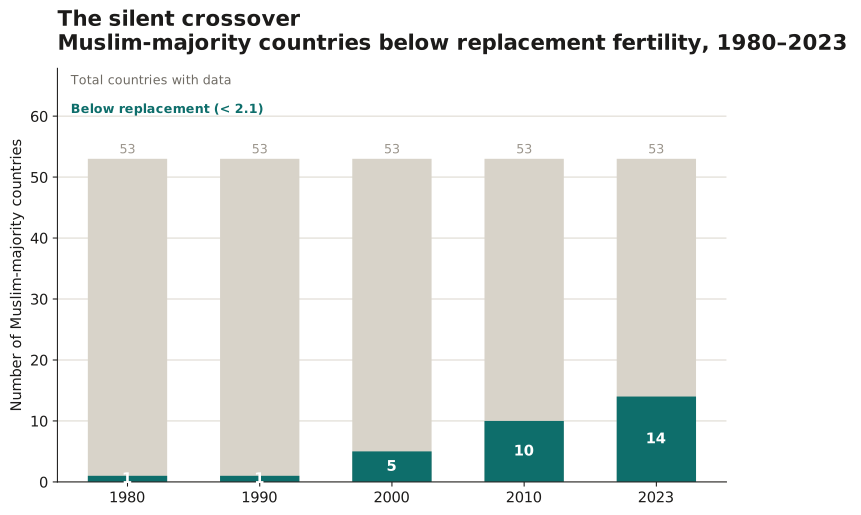
The club below replacement is not who you'd expect from the headlines. It includes the Islamic Republic of Iran (1.7 — lower than France was a decade ago), the Gulf monarchies, Turkey, Tunisia, Malaysia, and the Balkans:
Meanwhile the countries still above 4 children per woman tell you what the real dividing line is. It is not Islam — it is the Sahel. Afghanistan, Yemen, and a belt of Sub-Saharan states (Niger, Chad, Mali, Somalia, Nigeria, Sudan and neighbors) are the last holdouts, and nearly all of them are falling too, just from a later start.
03 — What this meansStop preparing for the explosion. Prepare for the aging.
Every dollar of policy attention spent fearing a Muslim population explosion is a dollar not spent on the actual future: Iran, Turkey, Tunisia and the Gulf states will age before they get rich. Pension systems designed for six-child families will meet two-child realities. The demographic dividend — that one-time window when workers vastly outnumber dependents — is open right now across North Africa and South Asia, and it will not stay open.
The mismeasurement matters because it inverts the map. The question for 2050 is not "how will the world absorb all these Muslim babies?" It is "who will care for elderly Iranians, and what happens to economies from Casablanca to Dhaka when the biggest youth cohort in their history hits retirement with thin savings and smaller families behind them?"
The fine print — read before quoting
- The US "15 years" in Fig. 2 is a baby-boom artifact: America briefly spiked near 3.7 in the 1950s–60s, which makes its mechanical 6→3 descent look fast. It proves nothing about transition speed and we flag it rather than hide it.
- France and the UK are absent from the chart because their transitions predate the 1950 data. Historical demography puts their 6→3 journeys at 70–100 years — which, if anything, strengthens the claim.
- Replacement level (2.1) assumes low mortality; in high-mortality settings the effective replacement rate is higher.
- Below replacement ≠ shrinking. Population momentum — the huge cohort of young parents already born — means these countries keep growing for decades. The bust is in the fertility rate; the population peak comes later.
- The UN data are estimates, revised each cycle; figures for conflict states (Syria, Yemen, Afghanistan) carry wide uncertainty.
The most mismeasured region on Earth is mismeasured for a reason: the old numbers flatter old fears. But the data are unambiguous. The baby bust is here, it is faster than anything in the demographic record, and the countries at its epicenter are the ones the headlines got most wrong.